
Source-ready backup-power data for reporting.
Download the underlying data, reuse attribution-ready graphics, embed our interactive widgets, and cite the methodology directly. Our studies separate source-published values from derived calculations so reporters can see exactly what is measured, published or estimated.
Current research library
Each study page includes source links, methodology and caveats. CSVs are provided for independent analysis; selected datasets also expose public JSON.
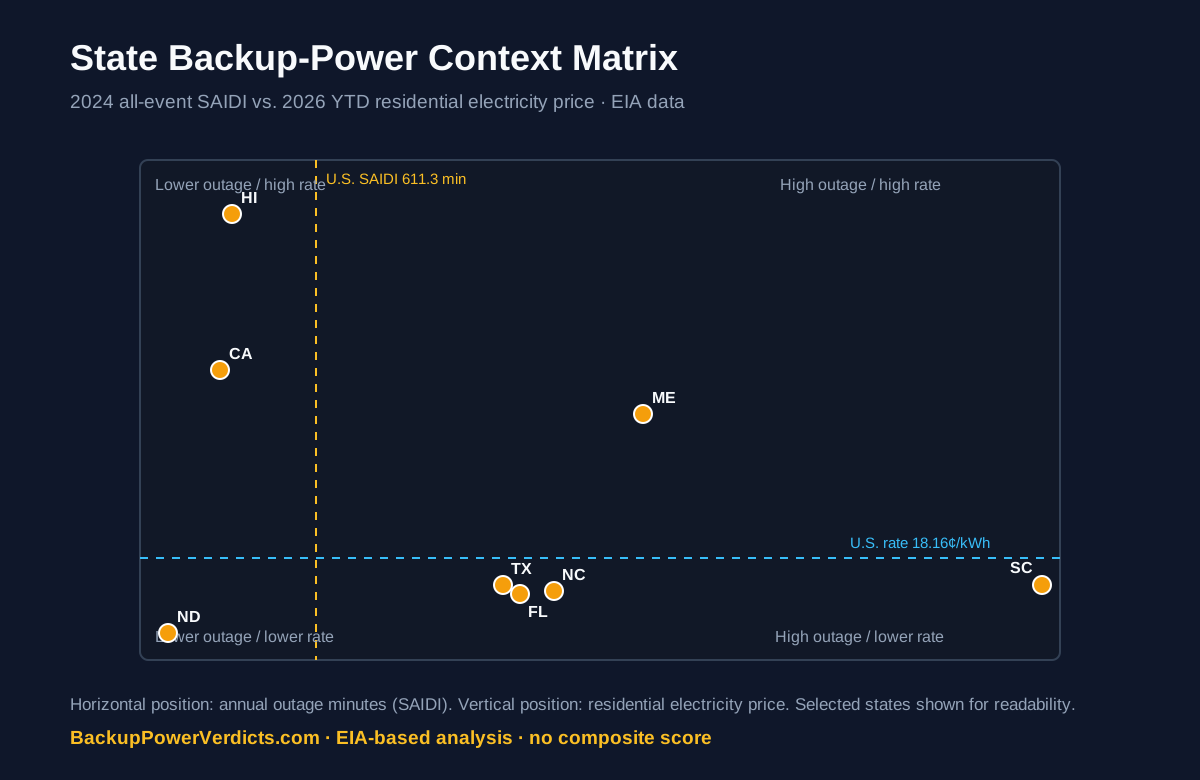
State Backup-Power Context Matrix 2026
The matrix places states on two independent axes—2024 outage duration and 2026 residential electricity price—relative to U.S. benchmarks, without an opaque composite score.
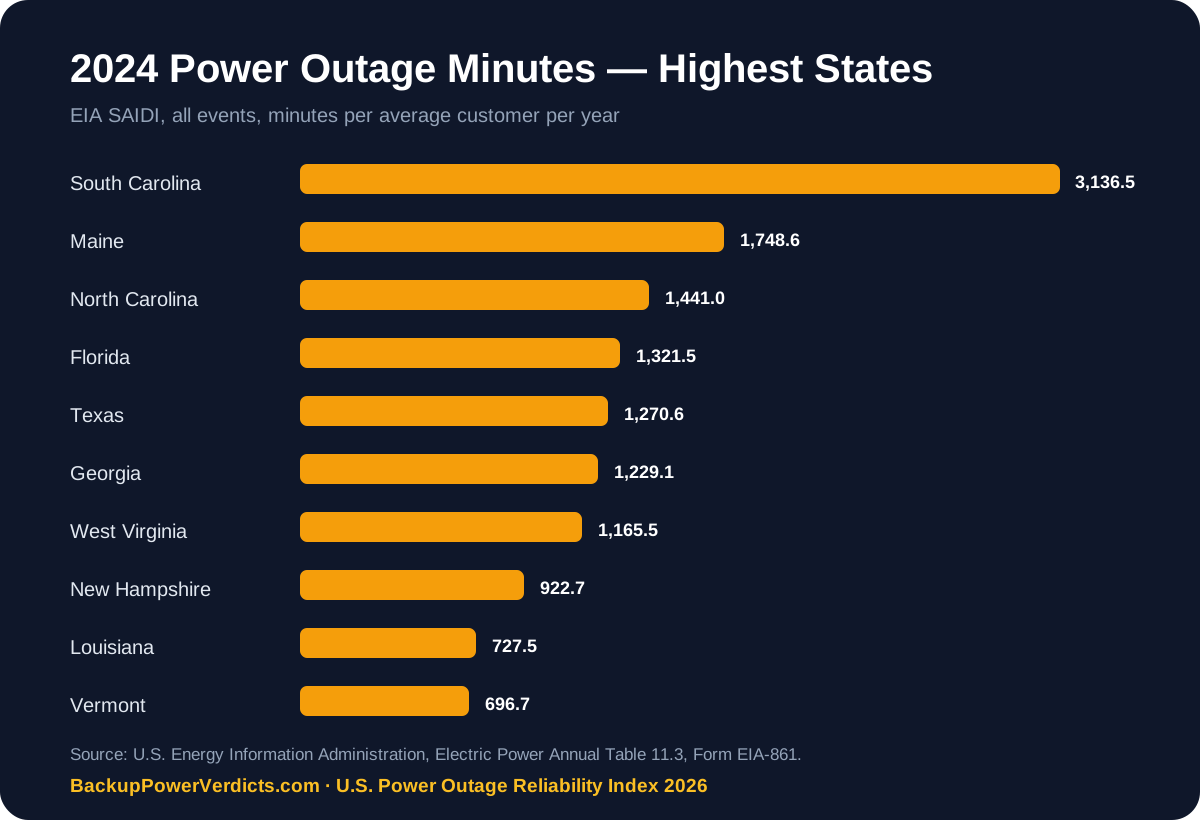
U.S. Power Outage Reliability Index 2026
South Carolina recorded the highest 2024 all-event SAIDI in the EIA state table: 3,136.5 minutes, or about 52.3 hours, per average customer.
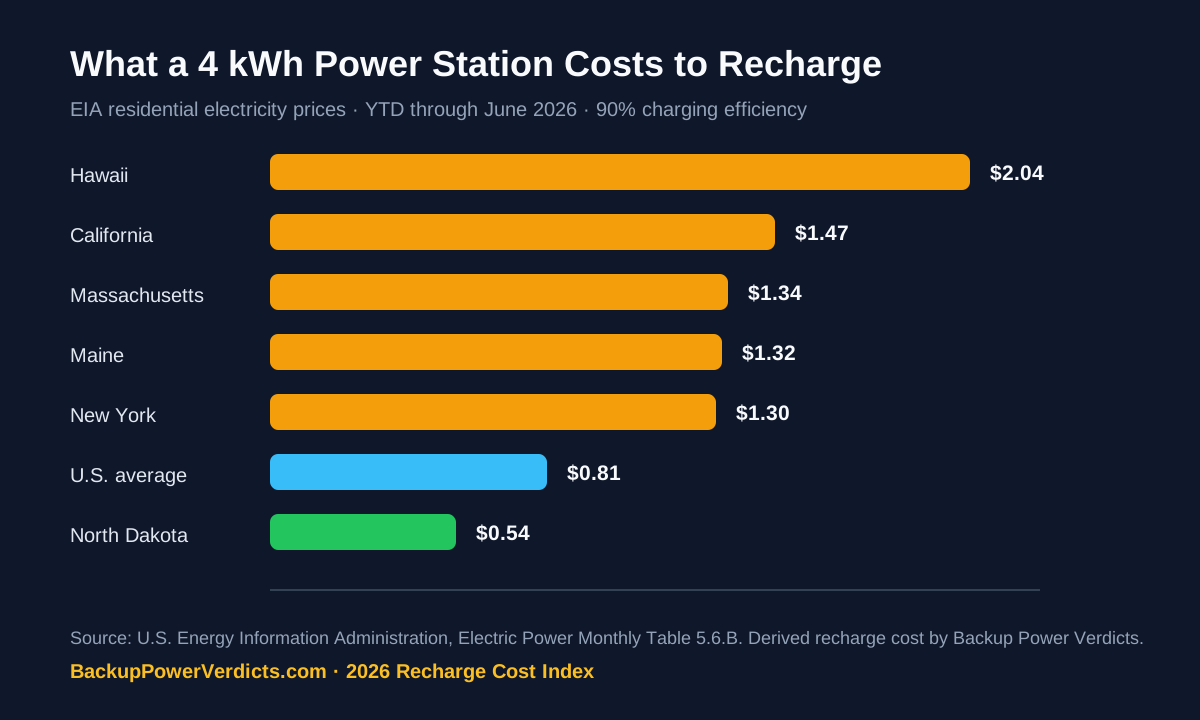
Power Station Recharge Cost Index 2026
Using EIA 2026 year-to-date residential prices and a 90% charging-efficiency assumption, a nominal 4 kWh refill ranges from about $0.54 in North Dakota to $2.04 in Hawaii.
Portable Power Station Specification & Runtime Index
Sixteen current models are normalized across capacity, AC output, solar input, weight, energy density and standardized runtime estimates.
Critical Load Runtime Index
Five standardized outage profiles are applied across 16 source-linked power stations, producing 80 comparable runtime rows.
Warranty & Cycle-Life Index
Warranty years, extension requirements and published battery-cycle claims are separated so contractual coverage is not confused with projected battery lifespan.

Portability & Recharge Scorecard
The 16-model scorecard compares Wh/lb, inverter W/lb and battery-capacity-to-rated-solar-input ratio without an opaque composite score.

EIA outage reliability
State SAIDI, SAIFI and CAIDI analysis uses U.S. Energy Information Administration Form EIA-861 reliability data. Derived major-event minutes are explicitly labeled as our calculation.
EIA electricity prices
Recharge-cost analysis uses EIA Electric Power Monthly residential electricity prices. State-average rates are comparison baselines, not individual utility quotes.
Power-station specifications
Capacity, output, solar input, weight, warranty and cycle-life fields link back to current manufacturer pages or policies used in the dataset.
Embed interactive backup-power tools
These lightweight iframe widgets are free for publishers, educators and newsrooms to reuse with the built-in attribution link intact.
Battery runtime calculator
Lets readers estimate runtime from battery watt-hours, load, efficiency and reserve. The widget links back to the full methodology and calculator.
Embed code
<iframe src="https://backuppowerverdicts.com/embed/runtime-calculator/" title="Backup power runtime calculator" width="100%" height="470" style="border:0" loading="lazy"></iframe>
State outage reliability snapshot
Lets readers choose a state and view 2024 EIA SAIDI, SAIFI and the derived share of outage minutes associated with major events.
Embed code
<iframe src="https://backuppowerverdicts.com/embed/state-outage-snapshot/" title="State power outage snapshot" width="100%" height="430" style="border:0" loading="lazy"></iframe>
Please keep the built-in Backup Power Verdicts attribution link intact. If your CMS blocks iframes, you may reuse our downloadable charts instead.
Public JSON endpoints
These endpoints are designed for journalists, researchers, developers and data projects. They are read-only and include CORS headers for public use.
Power stations
Current source-linked product specifications for the 16-model tracked database.
State backup-power context
Joined outage and 2026 residential electricity-rate context with transparent U.S. benchmarks.
How to cite or reuse the work
Newsrooms, researchers, publishers and educators may cite study findings and reuse the downloadable charts with attribution to Backup Power Verdicts and a link to the relevant study page.
For derived metrics, describe them as Backup Power Verdicts calculations based on the named source dataset. For example: “Backup Power Verdicts analysis of EIA Form EIA-861 data.”
Do not present our standardized runtime, recharge-cost, benchmark-quadrant or cycle-frequency calculations as laboratory measurements or source-published rankings. They are modelled or derived values using the assumptions stated on each study page.
When reporting a raw EIA or manufacturer value, cite the original source as well as our analysis when relevant. When reporting one of our derived rankings, normalized metrics or standardized scenarios, link to the Backup Power Verdicts study containing the methodology.
Corrections
If a manufacturer revises a specification or a public dataset is updated, we prefer to correct the underlying dataset and methodology rather than silently overwrite a conclusion. See our Editorial Policy for the research standard.
More ways to explore the data
Research hub → · Interactive tools → · Product database → · Research RSS →