
U.S. Power Outage Reliability Index
We converted the latest full-year EIA state reliability table into a searchable backup-power dataset. It shows how many minutes of non-momentary interruptions the average customer experienced, how often interruptions occurred, and how much major events changed the result.
Source: U.S. Energy Information Administration, Electric Power Annual Table 11.3, Form EIA-861. The latest full-year table available as of September 2026 contains 2024 data.
South Carolina
3,136.5 minutes (52.3 hours) of average annual interruption duration including major events.
District of Columbia
32.6 minutes (0.5 hours) in the same EIA any-method table.
10.2 hours
611.3 minutes including major events versus 126 minutes without major events—a difference of 8.1 hours.
States with the most outage minutes
The chart uses 2024 all-event SAIDI from the same EIA table and includes attribution for editorial reuse.
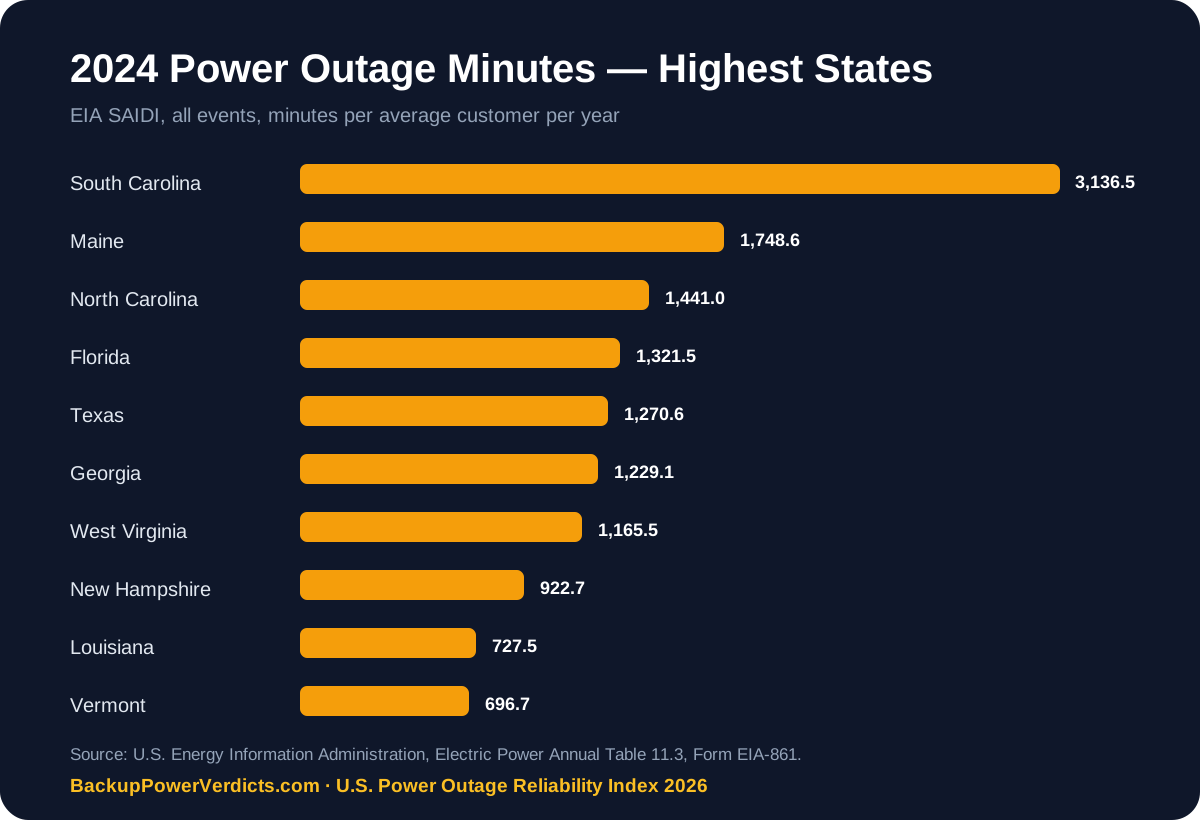
States with the most outage minutes in 2024
SAIDI is the average annual minutes of non-momentary interruption experienced by a customer. Higher values mean more time without service on average.
| Rank | State | SAIDI | Hours | Without major events | Derived major-event minutes | SAIFI |
|---|---|---|---|---|---|---|
| 1 | South Carolina | 3,136.5 min | 52.3 h | 117.8 min | 3018.7 min | 2.365 |
| 2 | Maine | 1,748.6 min | 29.1 h | 274 min | 1474.6 min | 3.636 |
| 3 | North Carolina | 1,441 min | 24.0 h | 141.4 min | 1299.6 min | 1.812 |
| 4 | Florida | 1,321.5 min | 22.0 h | 66.4 min | 1255.1 min | 1.770 |
| 5 | Texas | 1,270.6 min | 21.2 h | 129.4 min | 1141.2 min | 2.114 |
| 6 | Georgia | 1,229.1 min | 20.5 h | 212.3 min | 1016.8 min | 2.122 |
| 7 | West Virginia | 1,165.5 min | 19.4 h | 486.1 min | 679.4 min | 2.832 |
| 8 | New Hampshire | 922.7 min | 15.4 h | 132.3 min | 790.4 min | 2.021 |
| 9 | Louisiana | 727.5 min | 12.1 h | 206 min | 521.5 min | 2.722 |
| 10 | Vermont | 696.7 min | 11.6 h | 275 min | 421.7 min | 2.516 |
| 11 | Kentucky | 648.3 min | 10.8 h | 153.3 min | 495.0 min | 1.955 |
| 12 | Nebraska | 641.7 min | 10.7 h | 73.6 min | 568.1 min | 1.232 |
| 13 | Washington | 623.5 min | 10.4 h | 158.6 min | 464.9 min | 1.752 |
| 14 | Oregon | 591 min | 9.8 h | 130.9 min | 460.1 min | 1.346 |
| 15 | Mississippi | 567.1 min | 9.5 h | 266.3 min | 300.8 min | 2.555 |
| 16 | Ohio | 510.5 min | 8.5 h | 133.2 min | 377.3 min | 1.298 |
| 17 | Arkansas | 509.1 min | 8.5 h | 194.6 min | 314.5 min | 2.128 |
| 18 | Michigan | 470.4 min | 7.8 h | 160.1 min | 310.3 min | 1.356 |
| 19 | Virginia | 418.3 min | 7.0 h | 166.4 min | 251.9 min | 1.627 |
| 20 | Montana | 351.5 min | 5.9 h | 156.6 min | 194.9 min | 1.621 |
| 21 | Pennsylvania | 336.1 min | 5.6 h | 131 min | 205.1 min | 1.353 |
| 22 | Alaska | 327.1 min | 5.5 h | 192.4 min | 134.7 min | 2.591 |
| 23 | Hawaii | 320.6 min | 5.3 h | 225.6 min | 95.0 min | 2.616 |
| 24 | Indiana | 312.4 min | 5.2 h | 121.4 min | 191.0 min | 1.283 |
| 25 | Kansas | 285.6 min | 4.8 h | 103.6 min | 182.0 min | 1.506 |
| 26 | California | 279.6 min | 4.7 h | 158.2 min | 121.4 min | 1.345 |
| 27 | Alabama | 279.4 min | 4.7 h | 117.8 min | 161.6 min | 1.870 |
| 28 | New Mexico | 278.8 min | 4.6 h | 156.5 min | 122.3 min | 1.321 |
| 29 | Tennessee | 278.6 min | 4.6 h | 159.5 min | 119.1 min | 2.000 |
| 30 | Oklahoma | 270.9 min | 4.5 h | 119.6 min | 151.3 min | 1.731 |
| 31 | Wisconsin | 266.1 min | 4.4 h | 91.3 min | 174.8 min | 1.020 |
| 32 | Colorado | 255.1 min | 4.3 h | 119 min | 136.1 min | 1.409 |
| 33 | Idaho | 232.8 min | 3.9 h | 174 min | 58.8 min | 1.314 |
| 34 | Missouri | 224.3 min | 3.7 h | 106 min | 118.3 min | 1.189 |
| 35 | New York | 219.9 min | 3.7 h | 72 min | 147.9 min | 0.910 |
| 36 | Minnesota | 219.6 min | 3.7 h | 92.2 min | 127.4 min | 1.250 |
| 37 | New Jersey | 174.2 min | 2.9 h | 99.7 min | 74.5 min | 1.119 |
| 38 | Iowa | 166.7 min | 2.8 h | 89.8 min | 76.9 min | 1.150 |
| 39 | Nevada | 158.9 min | 2.6 h | 63.8 min | 95.1 min | 1.108 |
| 40 | Illinois | 156.9 min | 2.6 h | 59.4 min | 97.5 min | 0.852 |
| 41 | Connecticut | 153.6 min | 2.6 h | 73.1 min | 80.5 min | 0.876 |
| 42 | Wyoming | 137.8 min | 2.3 h | 109.1 min | 28.7 min | 0.999 |
| 43 | Utah | 119.8 min | 2.0 h | 106.7 min | 13.1 min | 1.030 |
| 44 | Maryland | 118.1 min | 2.0 h | 75.1 min | 43.0 min | 0.817 |
| 45 | Delaware | 116.1 min | 1.9 h | 65.9 min | 50.2 min | 0.843 |
| 46 | Rhode Island | 104.3 min | 1.7 h | 60.8 min | 43.5 min | 0.896 |
| 47 | Massachusetts | 102 min | 1.7 h | 76.1 min | 25.9 min | 0.843 |
| 48 | North Dakota | 99.1 min | 1.7 h | 84.2 min | 14.9 min | 0.915 |
| 49 | Arizona | 87.5 min | 1.5 h | 72 min | 15.5 min | 0.988 |
| 50 | South Dakota | 84.7 min | 1.4 h | 62.1 min | 22.6 min | 0.815 |
| 51 | District of Columbia | 32.6 min | 0.5 h | 26.4 min | 6.2 min | 0.271 |
Most interruption events
| State | SAIFI | SAIDI |
|---|---|---|
| Maine | 3.636 | 1748.6 min |
| West Virginia | 2.832 | 1165.5 min |
| Louisiana | 2.722 | 727.5 min |
| Hawaii | 2.616 | 320.6 min |
| Alaska | 2.591 | 327.1 min |
| Mississippi | 2.555 | 567.1 min |
| Vermont | 2.516 | 696.7 min |
| South Carolina | 2.365 | 3136.5 min |
| Arkansas | 2.128 | 509.1 min |
| Georgia | 2.122 | 1229.1 min |
Largest major-event duration gap
| State | Derived gap | Share of all-event SAIDI |
|---|---|---|
| South Carolina | 3018.7 min | 96.2% |
| Maine | 1474.6 min | 84.3% |
| North Carolina | 1299.6 min | 90.2% |
| Florida | 1255.1 min | 95.0% |
| Texas | 1141.2 min | 89.8% |
| Georgia | 1016.8 min | 82.7% |
| New Hampshire | 790.4 min | 85.7% |
| West Virginia | 679.4 min | 58.3% |
| Nebraska | 568.1 min | 88.5% |
| Louisiana | 521.5 min | 71.7% |
SAIDI, SAIFI and CAIDI
SAIDI is the total minutes of non-momentary interruption the average customer experienced during the year. SAIFI is the average number of non-momentary interruptions. CAIDI is the average restoration time per interruption.
This study uses EIA Table 11.3’s “Any Method” data, which combines utilities using IEEE reliability methods with utilities using other reporting methods. EIA separately publishes an IEEE-only table.
The “major-event minutes” column is our simple arithmetic difference between all-event SAIDI and SAIDI without major events. It is not an EIA-published metric by itself.
State averages combine many utilities and customer territories. A household can experience very different reliability from the statewide average. Coverage also varies by state, and EIA notes that its reported-customer percentage can occasionally exceed 100% because the numerator and denominator come from different survey schedules.
Why this belongs on a backup-power site
Backup-system sizing should be driven by your actual critical loads and outage objective, but public reliability data helps show where major events dominate annual outage duration and why recharge redundancy matters.
Reproduce the analysis
Download the CSV, or use the interactive state explorer to sort by duration, frequency, restoration time and derived major-event impact.