
State Backup-Power Context Matrix
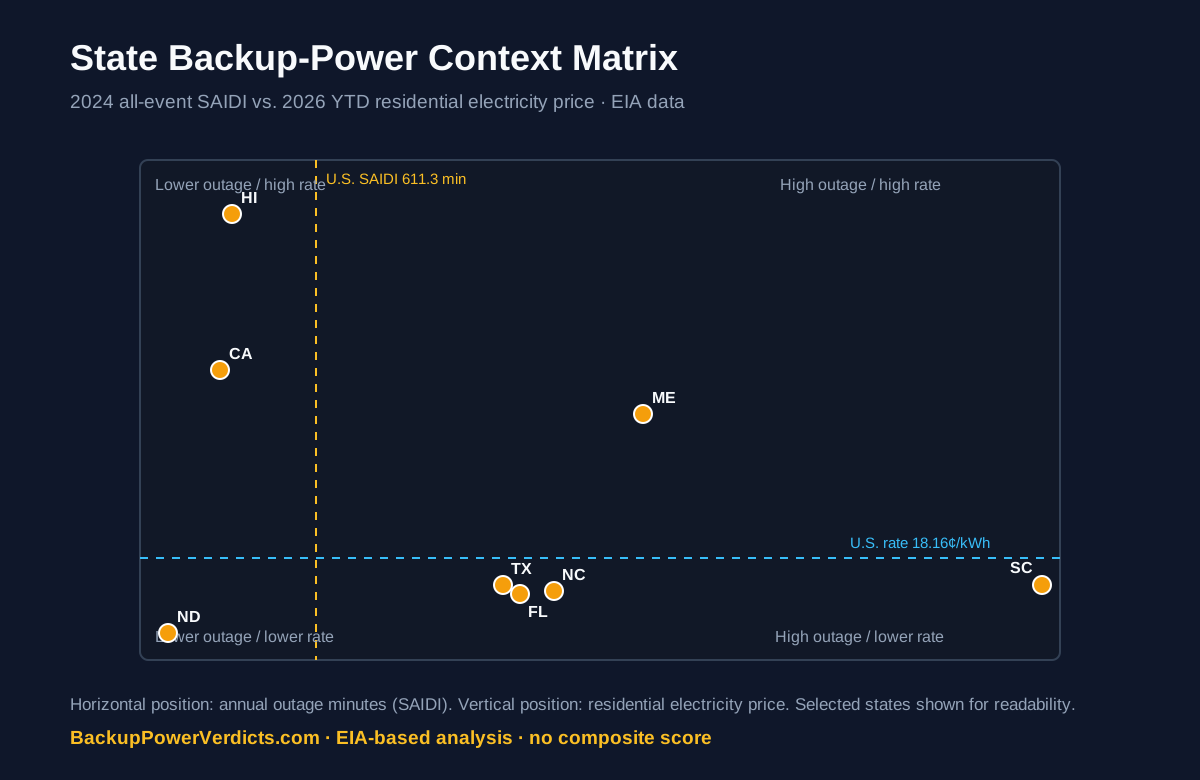
This matrix joins two different backup-power questions: how much sustained outage time the average customer experienced in 2024, and how expensive residential grid electricity has been in 2026. We show both axes separately instead of hiding them inside a subjective resilience score.
611.3 minutes
2024 all-event SAIDI for the U.S. total in EIA Table 11.3. States at or above this value are placed on the high-outage side of the matrix.
18.16¢/kWh
EIA residential electricity price, year-to-date through June 2026. States at or above this value are placed on the high-rate side.
2 independent axes
A state can have severe outage exposure but relatively inexpensive grid charging, or expensive electricity but relatively low annual outage duration.
Outage burden versus electricity price
The chart shows selected states for readability. The downloadable CSV contains all 51 jurisdictions.
What the quadrants reveal
These are benchmark groups, not labels of household risk or battery value. Utility territory and tariff can differ substantially within a state.
High outage / high rate
Maine, New Hampshire, Vermont
High outage / lower rate
Nebraska, Florida, Georgia, North Carolina, South Carolina, West Virginia, Kentucky, Louisiana…
Lower outage / high rate
Connecticut, Massachusetts, Rhode Island, New Jersey, New York, Pennsylvania, Illinois, Michigan…
Lower outage / lower rate
Indiana, Iowa, Kansas, Minnesota, Missouri, North Dakota, South Dakota, Delaware…
Maine
29.1 outage hours and 29.67¢/kWh.
South Carolina
52.3 outage hours and 16.04¢/kWh.
Hawaii
5.3 outage hours and 45.95¢/kWh.
Reliability and electricity price side by side
Sort and filter the same data in the State Outage Reliability Explorer.
| State | 2024 SAIDI | Hours | 2024 SAIFI | 2026 YTD rate | Major-event gap | Context |
|---|---|---|---|---|---|---|
| South Carolina | 3136.5 min | 52.3 h | 2.365 | 16.04¢/kWh | 3018.7 min | High outage / lower rate |
| Maine | 1748.6 min | 29.1 h | 3.636 | 29.67¢/kWh | 1474.6 min | High outage / high rate |
| North Carolina | 1441.0 min | 24.0 h | 1.812 | 14.90¢/kWh | 1299.6 min | High outage / lower rate |
| Florida | 1321.5 min | 22.0 h | 1.770 | 15.36¢/kWh | 1255.1 min | High outage / lower rate |
| Texas | 1270.6 min | 21.2 h | 2.114 | 16.11¢/kWh | 1141.2 min | High outage / lower rate |
| Georgia | 1229.1 min | 20.5 h | 2.122 | 15.19¢/kWh | 1016.8 min | High outage / lower rate |
| West Virginia | 1165.5 min | 19.4 h | 2.832 | 15.42¢/kWh | 679.4 min | High outage / lower rate |
| New Hampshire | 922.7 min | 15.4 h | 2.021 | 26.83¢/kWh | 790.4 min | High outage / high rate |
| Louisiana | 727.5 min | 12.1 h | 2.722 | 13.51¢/kWh | 521.5 min | High outage / lower rate |
| Vermont | 696.7 min | 11.6 h | 2.516 | 23.98¢/kWh | 421.7 min | High outage / high rate |
| Kentucky | 648.3 min | 10.8 h | 1.955 | 14.37¢/kWh | 495.0 min | High outage / lower rate |
| Nebraska | 641.7 min | 10.7 h | 1.232 | 12.70¢/kWh | 568.1 min | High outage / lower rate |
| Washington | 623.5 min | 10.4 h | 1.752 | 14.35¢/kWh | 464.9 min | High outage / lower rate |
| Oregon | 591.0 min | 9.8 h | 1.346 | 15.31¢/kWh | 460.1 min | Lower outage / lower rate |
| Mississippi | 567.1 min | 9.5 h | 2.555 | 15.35¢/kWh | 300.8 min | Lower outage / lower rate |
| Ohio | 510.5 min | 8.5 h | 1.298 | 18.53¢/kWh | 377.3 min | Lower outage / high rate |
| Arkansas | 509.1 min | 8.5 h | 2.128 | 13.43¢/kWh | 314.5 min | Lower outage / lower rate |
| Michigan | 470.4 min | 7.8 h | 1.356 | 21.14¢/kWh | 310.3 min | Lower outage / high rate |
| Virginia | 418.3 min | 7.0 h | 1.627 | 16.69¢/kWh | 251.9 min | Lower outage / lower rate |
| Montana | 351.5 min | 5.9 h | 1.621 | 13.77¢/kWh | 194.9 min | Lower outage / lower rate |
| Pennsylvania | 336.1 min | 5.6 h | 1.353 | 20.90¢/kWh | 205.1 min | Lower outage / high rate |
| Alaska | 327.1 min | 5.5 h | 2.591 | 26.86¢/kWh | 134.7 min | Lower outage / high rate |
| Hawaii | 320.6 min | 5.3 h | 2.616 | 45.95¢/kWh | 95.0 min | Lower outage / high rate |
| Indiana | 312.4 min | 5.2 h | 1.283 | 17.11¢/kWh | 191.0 min | Lower outage / lower rate |
| Kansas | 285.6 min | 4.8 h | 1.506 | 15.19¢/kWh | 182.0 min | Lower outage / lower rate |
| California | 279.6 min | 4.7 h | 1.345 | 33.17¢/kWh | 121.4 min | Lower outage / high rate |
| Alabama | 279.4 min | 4.7 h | 1.870 | 16.58¢/kWh | 161.6 min | Lower outage / lower rate |
| New Mexico | 278.8 min | 4.6 h | 1.321 | 14.82¢/kWh | 122.3 min | Lower outage / lower rate |
| Tennessee | 278.6 min | 4.6 h | 2.000 | 13.90¢/kWh | 119.1 min | Lower outage / lower rate |
| Oklahoma | 270.9 min | 4.5 h | 1.731 | 13.37¢/kWh | 151.3 min | Lower outage / lower rate |
| Wisconsin | 266.1 min | 4.4 h | 1.020 | 18.99¢/kWh | 174.8 min | Lower outage / high rate |
| Colorado | 255.1 min | 4.3 h | 1.409 | 16.65¢/kWh | 136.1 min | Lower outage / lower rate |
| Idaho | 232.8 min | 3.9 h | 1.314 | 12.80¢/kWh | 58.8 min | Lower outage / lower rate |
| Missouri | 224.3 min | 3.7 h | 1.189 | 13.45¢/kWh | 118.3 min | Lower outage / lower rate |
| New York | 219.9 min | 3.7 h | 0.910 | 29.26¢/kWh | 147.9 min | Lower outage / high rate |
| Minnesota | 219.6 min | 3.7 h | 1.250 | 15.98¢/kWh | 127.4 min | Lower outage / lower rate |
| New Jersey | 174.2 min | 2.9 h | 1.119 | 23.65¢/kWh | 74.5 min | Lower outage / high rate |
| Iowa | 166.7 min | 2.8 h | 1.150 | 13.77¢/kWh | 76.9 min | Lower outage / lower rate |
| Nevada | 158.9 min | 2.6 h | 1.108 | 13.79¢/kWh | 95.1 min | Lower outage / lower rate |
| Illinois | 156.9 min | 2.6 h | 0.852 | 19.22¢/kWh | 97.5 min | Lower outage / high rate |
| Connecticut | 153.6 min | 2.6 h | 0.876 | 28.82¢/kWh | 80.5 min | Lower outage / high rate |
| Wyoming | 137.8 min | 2.3 h | 0.999 | 13.88¢/kWh | 28.7 min | Lower outage / lower rate |
| Utah | 119.8 min | 2.0 h | 1.030 | 13.17¢/kWh | 13.1 min | Lower outage / lower rate |
| Maryland | 118.1 min | 2.0 h | 0.817 | 21.27¢/kWh | 43.0 min | Lower outage / high rate |
| Delaware | 116.1 min | 1.9 h | 0.843 | 17.74¢/kWh | 50.2 min | Lower outage / lower rate |
| Rhode Island | 104.3 min | 1.7 h | 0.896 | 29.45¢/kWh | 43.5 min | Lower outage / high rate |
| Massachusetts | 102.0 min | 1.7 h | 0.843 | 30.06¢/kWh | 25.9 min | Lower outage / high rate |
| North Dakota | 99.1 min | 1.7 h | 0.915 | 12.19¢/kWh | 14.9 min | Lower outage / lower rate |
| Arizona | 87.5 min | 1.5 h | 0.988 | 15.45¢/kWh | 15.5 min | Lower outage / lower rate |
| South Dakota | 84.7 min | 1.4 h | 0.815 | 14.33¢/kWh | 22.6 min | Lower outage / lower rate |
| District of Columbia | 32.6 min | 0.5 h | 0.271 | 24.54¢/kWh | 6.2 min | Lower outage / high rate |
Two EIA tables, one context view
The outage axis uses 2024 all-event SAIDI from EIA Electric Power Annual Table 11.3. The electricity-price axis uses the residential year-to-date average through June 2026 from EIA Electric Power Monthly Table 5.6.B.
We compare each state with the corresponding U.S. benchmark: 611.3 minutes of all-event SAIDI and 18.16¢/kWh. The resulting quadrant is descriptive only. No weights are assigned and no overall score is calculated.
Because the two datasets cover different periods, this page should not be read as a causal analysis between outage duration and electricity price.
High outage duration does not automatically mean a household should buy a larger battery. Actual backup sizing comes from critical loads, target outage duration, recharge options, local reliability and budget. State electricity prices also do not equal every customer’s tariff.
Useful next steps
Build a 24/72-hour load plan →
Calculate charging cost with your tariff →
Sources: EIA Table 11.3 and EIA Table 5.6.B.